Exercise 3: Monitoring & Load Testing
You are asked to set up a basic monitoring in a Spring Boot-based API project called Bahasa Indonesia Grammar API. You need to update the project dependency by including a library to enable Prometheus metrics on Spring Boot Actuator. You also have to enable the required endpoints that expose some information from the application, including metrics that can be collected by Prometheus and later visualised on Grafana
Once you have set up the monitoring stack locally, you need to run a load testing by creating a test plan using Apache JMeter. You only need to simulate a small number of users (e.g., 10 users at most) since the project interfaces with a Web application built by a third party and also to avoid performing denial-of-service to the aforementioned Web application. After running the load test, analyse the test results and the observed metrics to identify a performance issue in the project.
Background
Often times an application will pass testing and QA checks in the staging environment, but still present issues when running on the actual production environment. Monitoring can be employed to observe the application during runtime based on a set of exposed information such as metrics and logs. By doing so, we can anticipate possible issues that may arise in the production environment, and obtain data from the application during runtime that can be used for maintenance and further development.
Tasks Description
Start the exercise by forking the Bahasa Indonesia Grammar API project to your own account on GitLab CS. Then, clone the source code to your local development environment and ensure the project can run locally.
Once you have run the project locally, set up a monitoring stack locally using Prometheus and Grafana. You also need to update the project before it can be queried by Prometheus:
- Add the
implementation 'org.springframework.boot:spring-boot-starter-actuator'dependency to thebuild.gradle. - Add the
io.micrometer:micrometer-registry-prometheusdependency to thebuild.gradle. - Expose all endpoints, including Prometheus, by adding
management.endpoints.web.exposure.include=*in theapplication.propertiesfile.Warning: We are exposing all endpoints only for exercise purpose. In an actual production setting, we have to limit the exposed endpoints and secure them properly. Please keep that in mind if you have to actually set up the endpoints exposed by Spring Boot Actuator in your professional job!
After updating the project, you should be able to access the Prometheus metrics at /actuator/prometheus endpoint.
You can also try querying other endpoints exposed by Spring Boot Actuator, such as /actuator/health, /actuator/info,
and /actuator/metrics.
Note: The last endpoint, i.e.,
/actuator/metrics, is interesting because it provides similar metrics like Prometheus albeit in a different format.
The next step is to configure Prometheus to collect, or "scrape", the metrics from the project that runs locally.
Edit the Prometheus configuration file, i.e., prometheus.yml, so it scrapes the metrics endpoint from the project.
Note: For this exercise, you are not required to deploy the app. Running the app and scraping the metrics locally are enough.
Once you have edited the configuration file, ensure the Prometheus is able to scrape the metrics correctly.
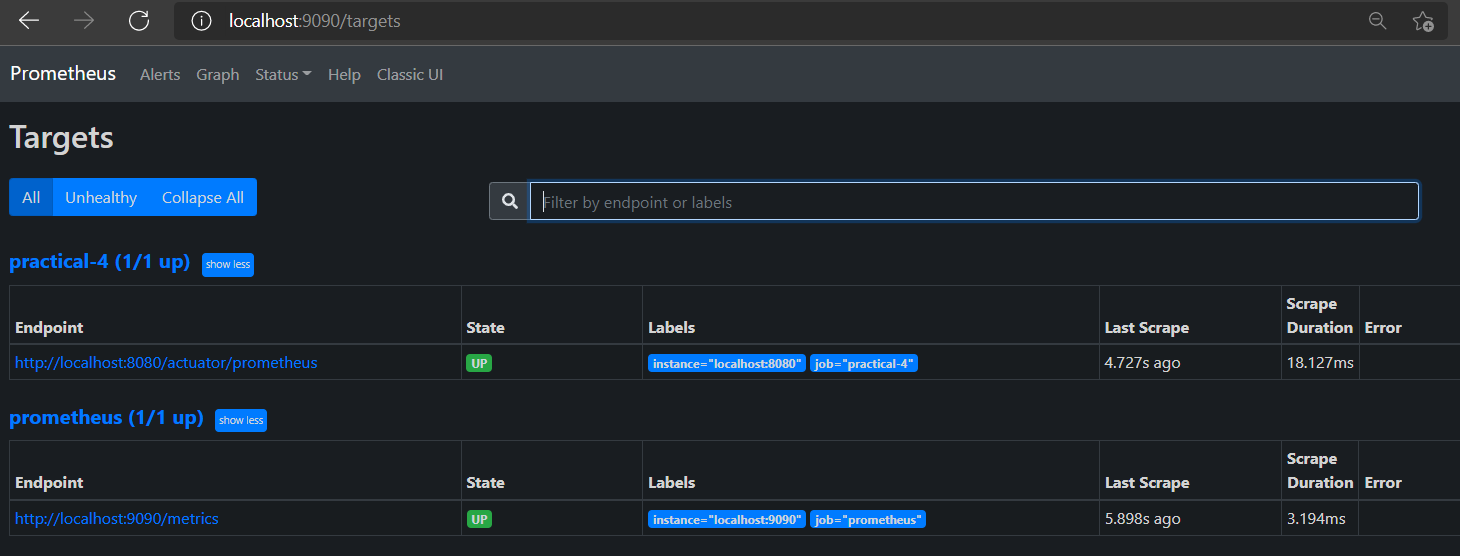
First, open the Prometheus web interface at http://localhost:9090/targets
and verify the application is listed in the list of scrape targets:
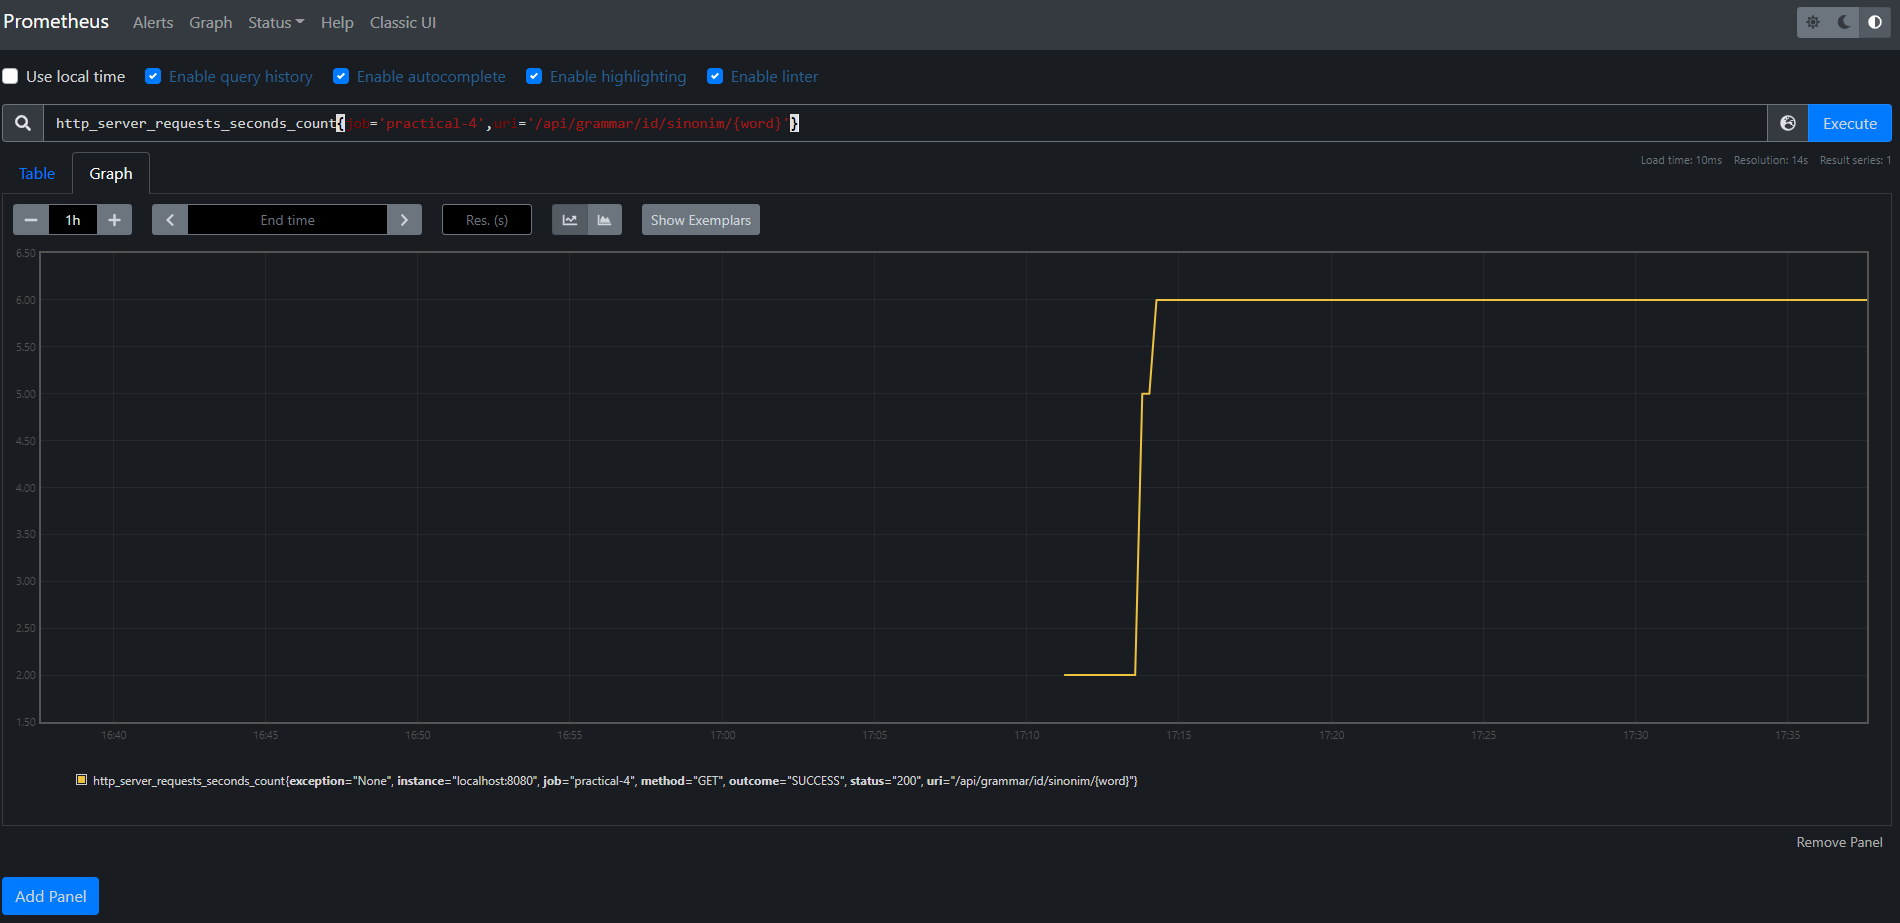
You then should be able to query some metrics. Spring Boot-based project includes some default metrics.
For instance, http_server_requests_seconds_count tracks the number of requests received by the application:
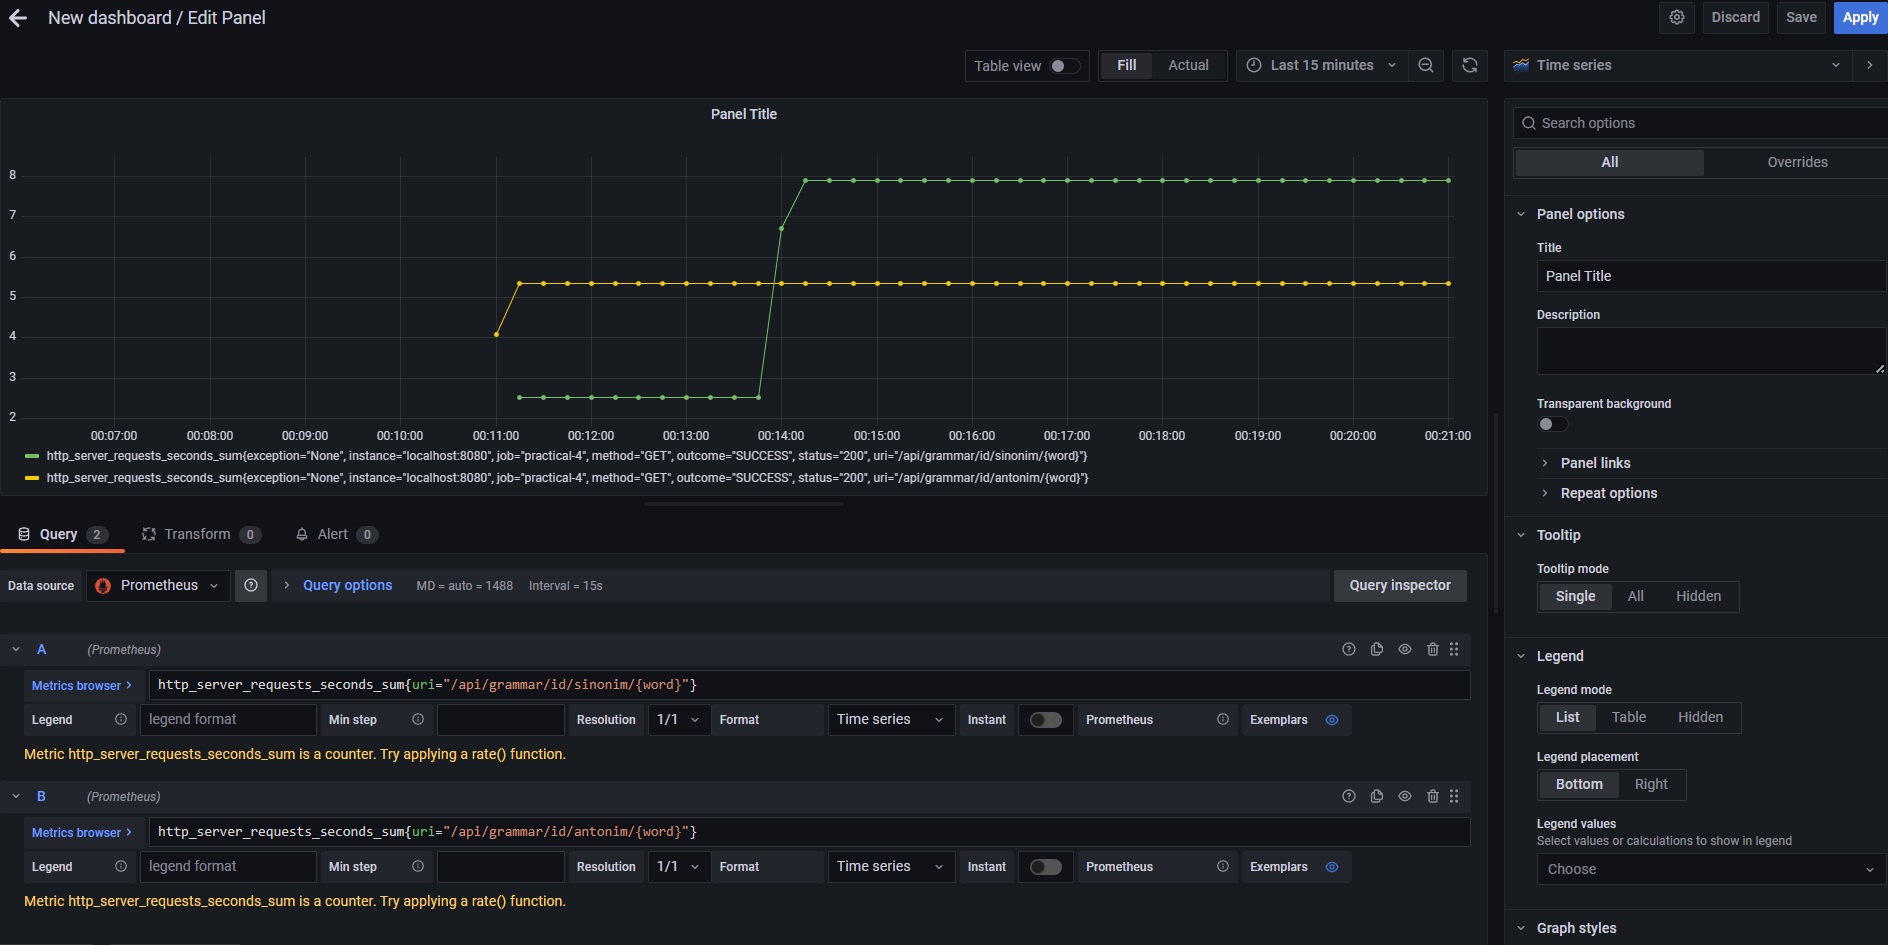
Although Prometheus provided a simple web interface for querying and visualising metrics, it is nicer to use a dedicated visualisation tool for this purpose such as Grafana. Now, configure the locally running Grafana by setting the local Prometheus as a data source in Grafana and try to visualise the metrics in a dashboard:
You can set up the dashboard manually to ensure the visualisation only contains relevant information that you need. Alternatively, you can use a dashboard template created by the community such as JVM (Micrometer) and use it as the template that you can customise.
At this point, the monitoring stack is ready. Now, begin to create a test plan using Apache JMeter.
As mentioned at the beginning of the document, you only need to simulate at most 10 concurrent users. Make sure you configure a Thread Group with the number of threads not exceeding 10 threads. Then, set up the correct Sampler to be run by each thread that exercises each endpoint with the required input. Finally, set up one or more Listener in the test plan to create the test report.
Try to run the test plan using JMeter in GUI mode. After hitting all endpoints several times, you are expected to see a performance issue from analysing the test report created by JMeter and metrics observed by Prometheus. Especially when the endpoints are hit by the same input keyword multiple times. That leads to the final task of this exercise: What is the performance issue present in the project and how it can be fixed?
Tasks Checklist
- Fork the Bahasa Indonesia Grammar API repository to your own account on GitLab CS.
- Clone the Git repository of the new fork into your local development machine.
- Open the cloned Git repository as a project using your favourite text editor or IDE that supports Java-based project.
- Create a new branch named
exercise3from themainbranch of your cloned fork. - Set up Prometheus and Grafana locally
- Update the project so it can expose Prometheus metrics
- Run the application and ensure the monitoring works
- Prepare a JMeter test plan that simulates at most 10 concurrent users using the application
- Run the test plan and observe the metrics visualised on Grafana
- Identify the performance issue currently present in the application
- Fix the performance issue and re-run the test plan
- Compare the results both from test report generated by JMeter and metrics observed by Grafana
- Write a short report describing your attempt on the exercise
- Do not forget to commit and push your changes to your fork on GitLab CS!
Deliverables
At the end of this exercise, you are required to prepare the following artefacts:
- A written document that describes the process of your work in completing
this exercise. You can write the document as a Markdown-formatted text file
or a PDF file. Give the document a descriptive name, e.g.
EXERCISE_3_REPORT.md, and put it into a folder calleddocsin your fork codebase. - A JMeter test plan you use to run the load testing.
Name the test plan filename as
exercise3.jmx. Store it in the fork codebase. - The codebase itself where you have configured the project to export Prometheus metrics and fixed the performance issue. Make sure you have committed and pushed the latest changes and ensure the tests still pass.
The due date of this exercise is: 6 December 2024, 23:55 UTC+7. Please ensure any updates to the fork repository related to this exercise were made and pushed before the due date.
Acknowledgements
The exercise instruction and the project are based on Exercise 4 of the Advanced Programming (International Class) course year 2023, and prepared by Adrika Novrialdi and Fardhan Dhiadribratha Sudjono. The original exercise instruction is modified by adding a task related to Apache JMeter and load testing.
Created: 2023-11-29 18:12:44


